


 12 / 56

As we look at the panoramic
view of the year for 2014 —
year over year — we con-
tinue to see all the ways the
vacation ownership industry
is rebuilding and growing key
revenue lines once more.
Sales Performance
Using the lens of the four quarterly pulse surveys
prepared for the ARDA International Foundation
(AIF) by Deloitte & Touche LLP in 2014, here are
some of the strongest performance indicators
pointing the way to the resurgence.
Unpacking the Data
There’s an overall increase of tours that is driving
up sales across the board. And along with those
good-news points, we are seeing that volume per
guest (VPG) rates are also down for two of the
four quarters (Q2 & Q3).The fluctuation in VPG
coupled with the overall increase in tours may
suggest that the industry is working on bringing in
more new buyers vs. repeated buyers.
This movement into the market of first-time
owners indicates the kind of progress we like to
see for vacation ownership across the board, as
the upcoming release of the 2015
State of the
Vacation Ownership Industry
report will only
underscore. All of this bodes well for sustainable
growth in new markets and going beyond our
loyal existing owner base.
Darla S. Zanini, RRP, is executive vice president of
the ARDA International Foundation (AIF).
10
IN BRIEF
RESORTDEVELOPER.COM
vacation industry review
JULY – SEPTEMBER 2015
Pointing the Way to Growth
AIF Quarterly Surveys Show Continued
Climb in Timeshare Sales
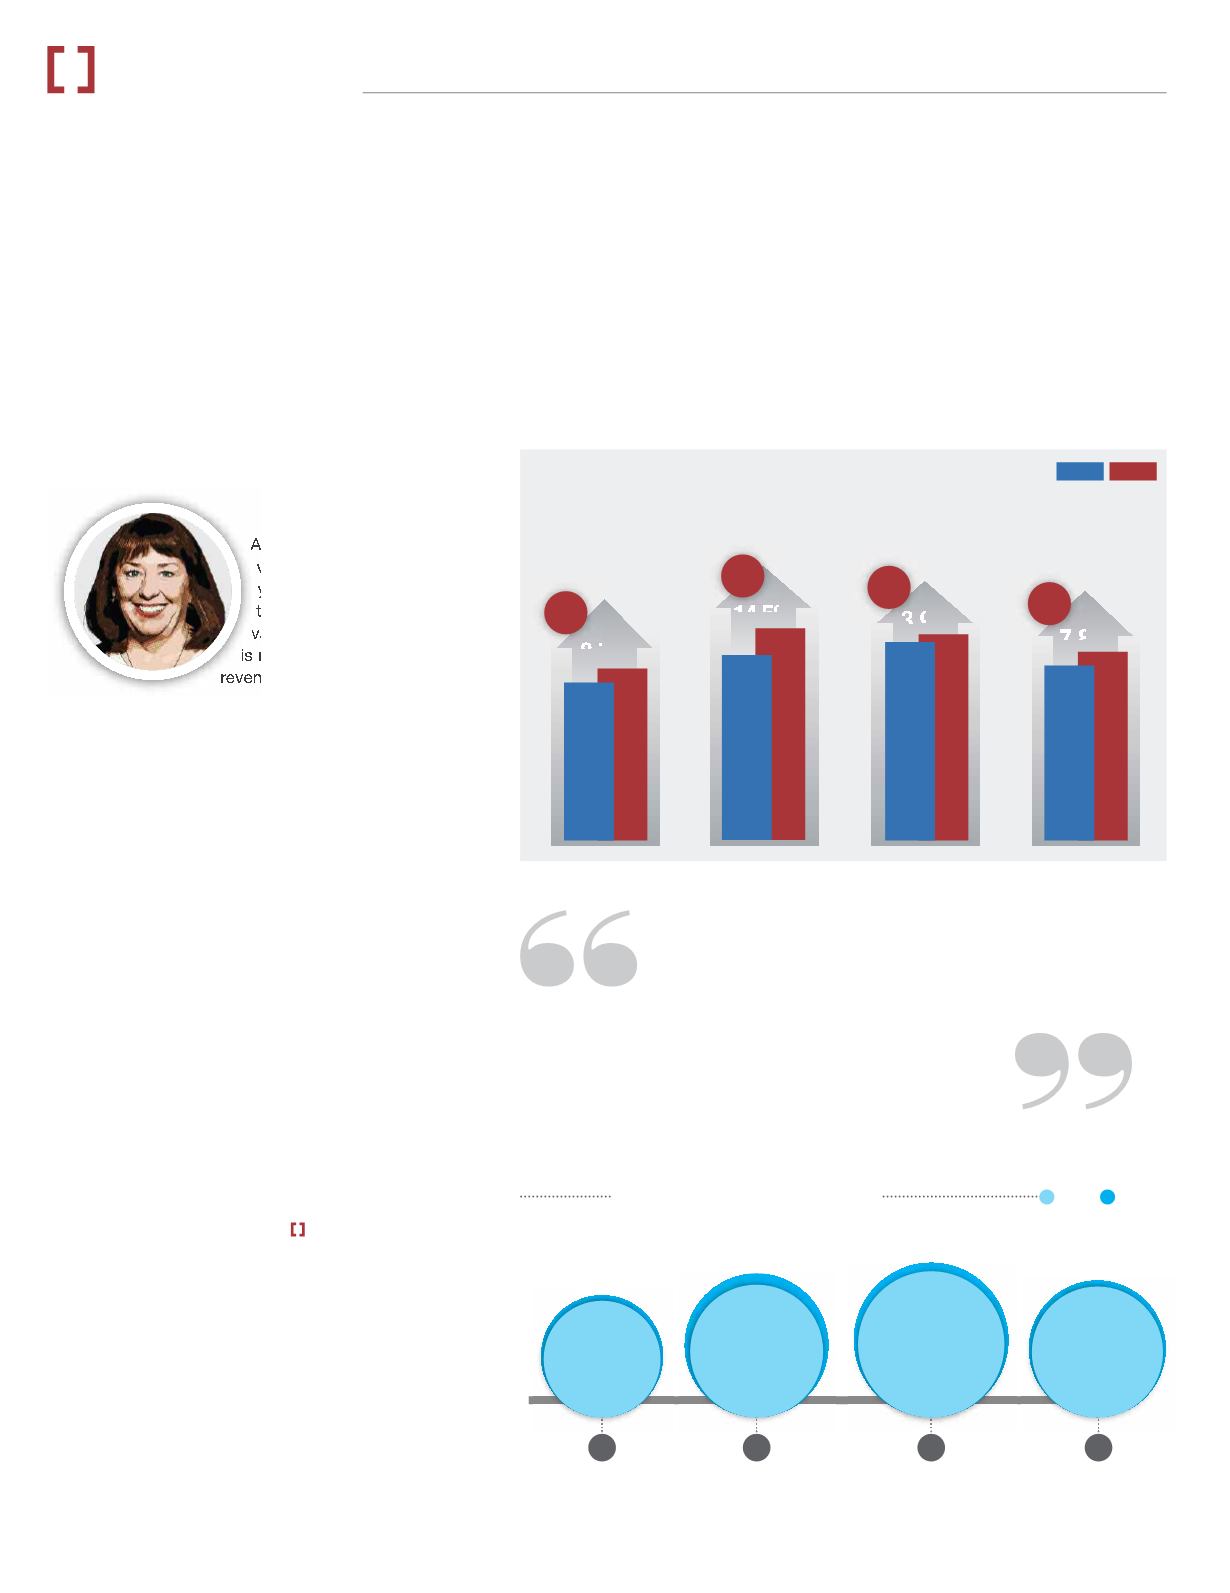
Sales Performance
2014 pulse report
Net-originated timeshare sales (including telesales & fee-for-service):
US$1.230 billion
US$1.340 billion
US$1.467 billion
US$1.680 billion
US$1.593 billion
US$1.655 billion
US$1.515 billion
2013 2014
8.7%
14.5%
3.9%
7.8%
Q1
Q4
Q3
Q2
TOURS ARE UP
2013 2014
By Darla S. Zanini
Q1
The fluctuation in VPG coupled with the
overall increase in tours may suggest that
the industry is working on
bringing in
more new buyers vs. repeat buyers
.
Q2
Q3
Q4
US$1.634 billion
Source: Deloitte & Touche
483,730
639,374
593,469
548,455
500,201
627,965
667,293
564,475